Business intelligence solutions

Analyse data and eliminate challenges with a central solution

Adobe Commerce Business Intelligence for eCommerce

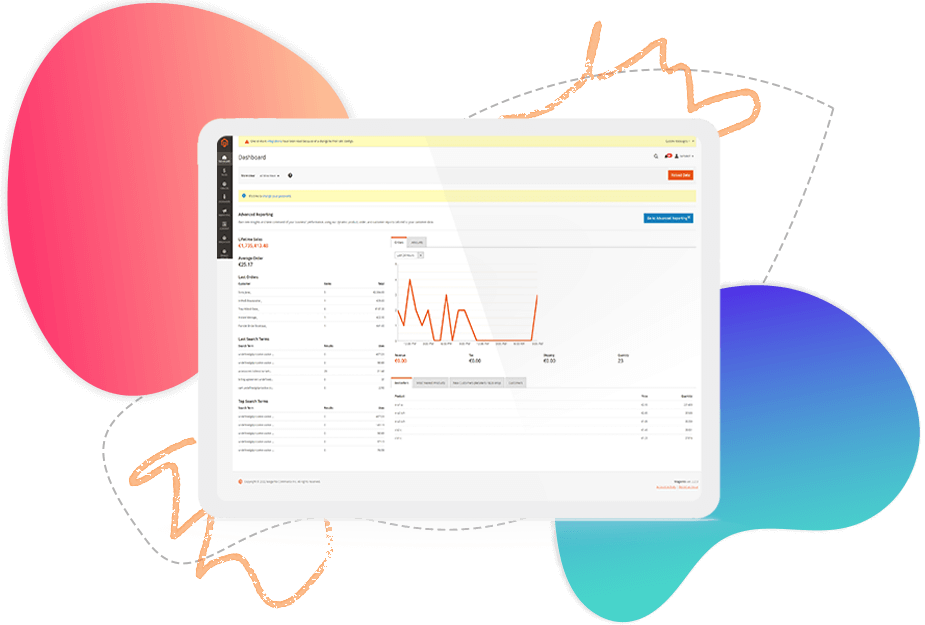
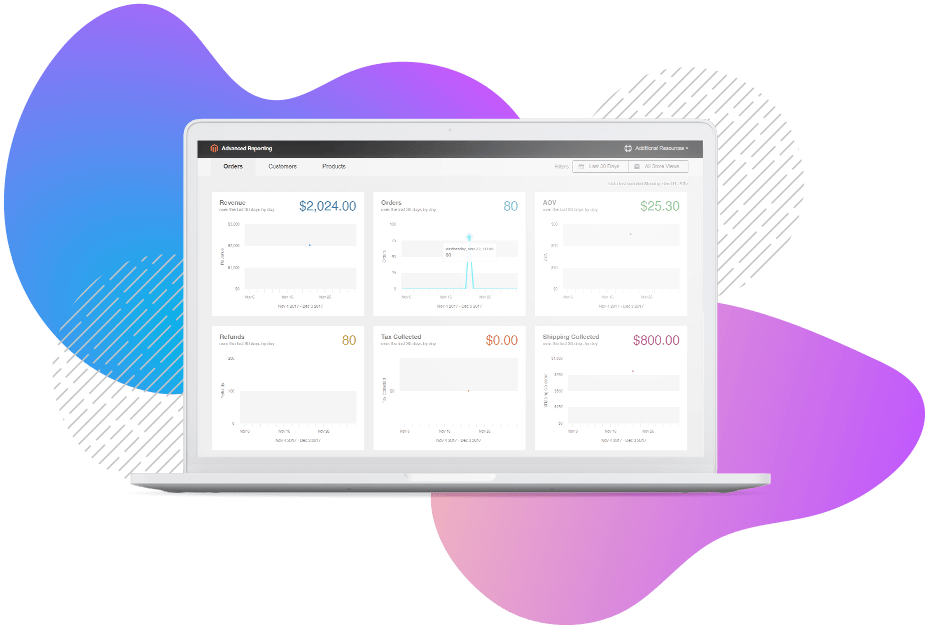
Business intelligence ecommerce solutions make monitoring business health simple. Analyse data from across your operations and never worry about figuring out your Average Order Value, Customer Lifetime Value or Retention rates again. Learn all about business intelligence solutions and what to expect from a business intelligence platform.

What you’ll learn

  • What is Business Intelligence?
  • Business Intelligence benefits
  • Challenges of Business Intelligence
  • Why Adobe Commerce for Business Intelligence?
  • FAQs

What is Business Intelligence?


Every day, your business generates huge amounts of data from sales and logistics channels, social media platforms and elsewhere. Harnessing this information is important - organisations which make data-led decisions are more likely to be high financial performers. But with so many platforms storing your data, how do you connect the dots?

Business intelligence is the process of gathering and analysing this data. Used effectively, it can help you:

  • Spot market trends
  • Increase your profitability
  • Identify barriers in your process

How does it work?

Business Intelligence platforms - such as Adobe Commerce, powered by Magento - bring all your data together in one place. They store, sync and present information from across your operation in a cloud-based warehouse - so you can analyse, learn and make data-driven decisions.

  • Visualise your data with crystal-clear tables, bubble charts and graphics.
  • Integrate your sales, marketing and logistics data into one cloud-based database.
  • Share your insights with your team - steering the direction and making changes happen.

Business intelligence vs analytics

Business intelligence is often used interchangeably with business analytics, but there are subtle differences.

Business analytics is a sub-section of business intelligence. It uses data gathered from business intelligence to anticipate trends and outcomes, encompassing:

  • Data mining
  • Predictive modelling
  • Statistical analysis
  • Data analysis

So, if you’ve had a regional spike in sales, this will be reflected in your business intelligence data. You can drill down into the specifics of where these sales are happening and why the spike occurred.

At this point, analytics steps in and answers the ‘why’. This helps you to make informed predictions about the future - and decide if a regional spike in sales could become national.

Business Intelligence benefits

There are many benefits to good business intelligence practice. These include:

  • Faster analysis - intuitive, customisable dashboards make understanding your data easy. Our business intelligence platform draws data from across your business and presents it in an engaging and accessible manner.
  • Increased efficiency - with full oversight of all your data, you can take a holistic view of your operation and make it work more efficiently.
  • Data-led decisions - from sales forecasting to real-time data, you’ll have the hard evidence you need to back up your ideas.
  • Smoother internal processes - your staff will no longer need to compile reports or chase data from different departments.
  • Better customer experiences - smooth out process issues quickly. Bespoke customer service dashboards can help you to monitor relevant deliveries, queries and chats - and reduce support calls.

The challenges of Business Intelligence

Business intelligence can be a highly effective tool for your organisation, but it may present challenges: 

  • Lack of strategy - enterprise intelligence should always be based around strategy. Before starting, think about what issues you’re trying to solve and what your outcome should be.
  • Low uptake - making sure everyone is on board with your business intelligence plans is essential. With poor utilisation, your data will be undervalued and underused.
  • Poor training - Adobe makes business intelligence easy - but some training is needed for the best results. Book a demo today to get to grips with business intelligence.

How to get started with Business Intelligence

To get the best from your enterprise intelligence platform, you’ll need a strategy. Follow these steps to get started:

  • Get your business on board. Starting your business intelligence journey relies on sign-off and support from across the organisation. Spread the word and get people interested from early on.
  • Create a business intelligence team. Regardless of the size of your organisation, you’ll need people who are passionate about enterprise intelligence. With our platform, you don’t need an experienced analyst to understand your data.
  • Set your objectives. Consider what you want to achieve. Do you want to measure marketing, logistics, sales performance or all of the above? Identify KPIs and business goals and sync with your business intelligence objectives.
  • Prepare your data. From Facebook to Outlook, consider the platforms, apps and tools you’ll be connecting.
  • Be proactive. Think about your milestones and key dependencies for success. Build a roadmap for your first year of BI and think about what success will look like. Don’t let it become a reactive tool for producing reports.

Ready to get started?

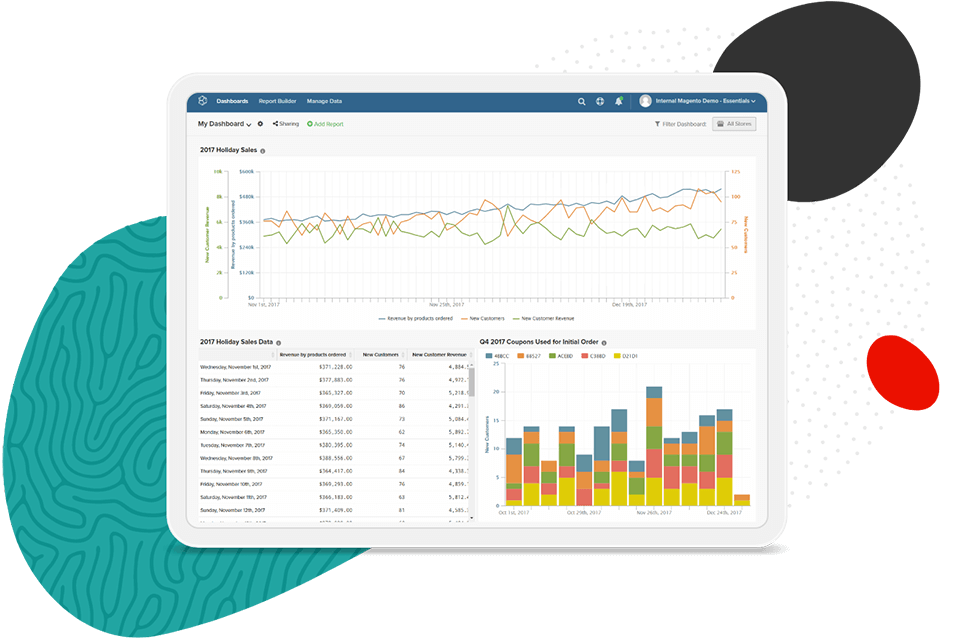
Our business intelligence platform is built on Adobe Commerce, powered by Magento. Our out-of-the-box solution provides vital commerce dashboards that make it simple to monitor business health.

To learn how you can make the most of Adobe Commerce, powered by Magento, request a personal consultation.

Get a personalised demo

FAQs

What are the five basic tasks of Business Intelligence?

Broadly, business intelligence incorporates the following:

  • Data mining - digging deep into your business’ multi-channel activities and extracting the data.
  • Process analysis - making sure your business runs smoothly. This could include identifying lags in your supply chain, slow-to-ship orders or customer service issues.
  • Benchmarking - setting standards and points of reference to measure future activities.
  • Descriptive analysis - measuring historical data to understand your performance. This could include month-by-month or year-on-year reporting.
  • Business and data analysis - the use of data to predict future outcomes.

What kind of businesses use Business Intelligence?

Business intelligence is most used in sales, finance, operations and marketing departments. Its adaptability for processes, performance and predictions makes it a highly valuable asset across a range of industries. Business intelligence for eCommerce helps organisations of all sizes monitor their operations.

What is a Business Intelligence role?

Some businesses have dedicated data and analytics professionals to monitor business intelligence. An example of this might be a data officer. A dedicated team in this area is very useful for larger businesses - but Adobe Commerce, powered by Magento makes business intelligence easy for smaller enterprises too.


A single home to store your data

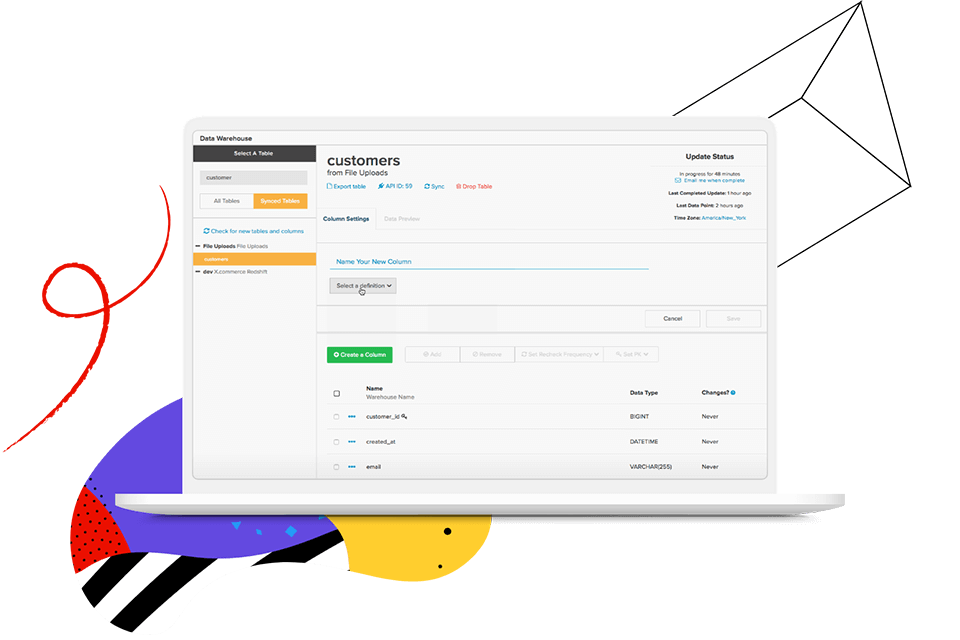
Integrated data pipeline and data warehouse technology.

  • Directly integrated with your Adobe database
  • Multiple ways to connect other systems
  • Full-stack, automated data replication technology
  • Central cloud-based warehouse for consolidated data
  • Extensive control and management
 

A dedicated space to analyse

One platform to turn data into value.

  • Create calculated columns and join tables
  • Customise and standardise your business metrics
  • Build analyses with the easy-to-use report builder
  • Query your entire data warehouse for specific results
  • Extend the use of your data with export capabilities
 

A whiteboard to visualise

Visualisations and tools to share insights with everyone.

  • Turn your data into something visual
  • Access pre-built reports on day one
  • Stay organised with unlimited dashboards
  • Empower users with various user permission levels
  • Schedule and send analysis right to people’s inbox
 

Stunning visualisations with dynamic scatter and bubble charts

Drive deeper analyses by adding a related third dimension to any report. Go from plotting x and y values to plotting x, y and z values which are represented by the size of the bubble. Group the bubbles by another attribute to segment even further and change the bubble colours.

Call us

+49 30 863 232 940

Email us

email-us
Adobe Solutions Partner
Test SBO free of charge Test SBO free of charge
Contact us Contact Us
twitter
Update cookies preferences